Geneva: The conflict in Ukraine and recent pandemic-related lockdowns in China have apparently dampened global goods trade in the first half of 2022, according to the latest World Trade Organization (WTO) Goods Trade Barometer.
The current reading of 99.0 remains slightly below the baseline value of 100 for the index, which is a forward-looking composite of real-time indicators, suggesting continued slow growth in merchandise trade.
The latest outlook scales back the earlier optimism in the barometer from February, which suggested that trade might have been approaching a turning point, with stronger growth expected in the near future.
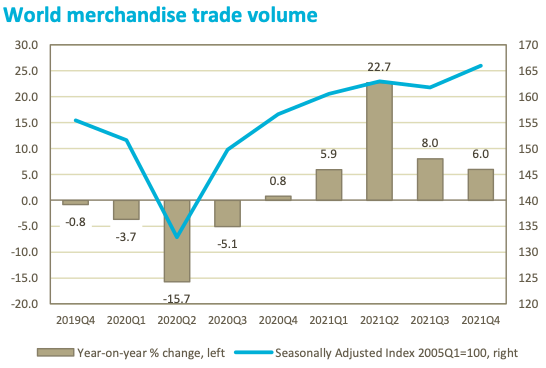
Quarterly trade statistics through the end of 2021 showed the volume of world merchandise trade expanding strongly in Q4 even as year‐on‐year growth slowed to 6.0% from 8.0% in Q3. Stronger year‐on‐year growth in Q3 was mostly due to the reduced volume of trade in the third quarter of 2020 following a pandemic induced slump.

In April 2022, the WTO forecasted a 3.0% growth in the volume of world merchandise trade in 2022, down from the 4.7% growth predicted as of last October. The current barometer reading is broadly consistent with the April projection, but forecasts are less certain at the moment than usual due to the unpredictable nature of the conflict and should be interpreted with care.
The Barometer is a composite leading indicator providing real-time information on the trajectory of merchandise trade relative to recent trends ahead of conventional trade volume statistics. Readings of 100 indicate growth in line with medium-term trends; values greater than 100 suggest above-trend growth while values below 100 indicate the reverse.

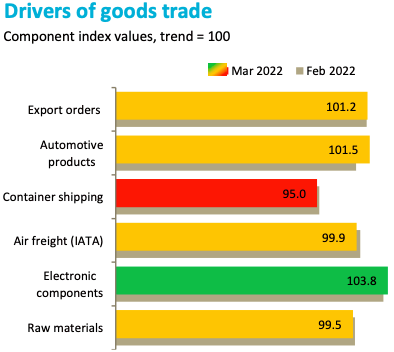
Many of the barometer’s component indices are close to or above their baseline value of 100, for example, export orders (101.2), automotive products (101.5), air freight (99.9), electronic components (103.8), and raw materials (99.5). Meanwhile, the container shipping index remains below trend (95.0) due to persistent port backlogs. Component indices are smoothed to minimize the influence of extreme values, but this may make them appear more positive than is necessarily the case. For example, non‐smoothed indices for export orders and air freight were above trend in February but below trend in March, resulting in on-trend average values. As a result, all indices should be interpreted with an appropriate degree of caution.
– global bihari bureau


