 By Dr Prem N. Sharma*
This is the second part of the article on the state of global Green House Gases (GHG) emissions, especially from agriculture-related activities including land use change, forestry, pasture lands, livestock and crop production and recommends technical and policy options for their mitigation and adaptation globally.
Also read: State of global Green House Gases emissions – 1
The extent of land degradation especially in pasture/grasslands
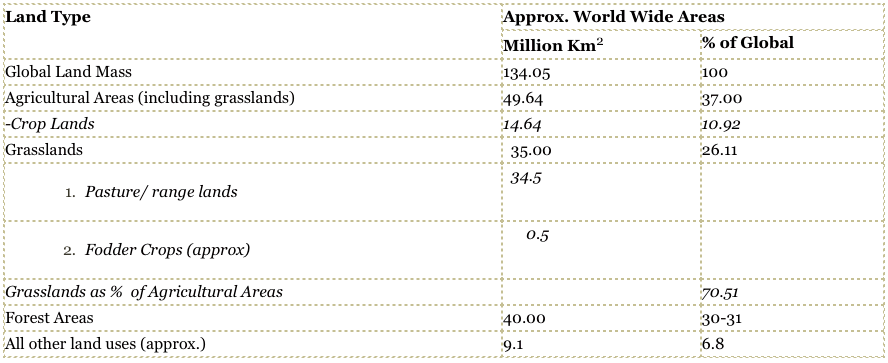
The earth’s total land mass (134.05 million Km2) consists of about 30-31% forest areas (FAO, 2010), 26% pasture/grasslands, 10-11% croplands and 6.8% other land use (wastelands, settlements, water bodies etc) as shown in Table 6. It is the major storehouse of GHG. For example, the top one meter of the world’s land mass stores 1,417 billion (Giga) tons (Gt) of carbon (C) out of which 456 Gt is stored in the top 30 cm itself. This is more than the total atmospheric GHG estimated at about 1,250 GtCeq (4,588 GtCO2eq). However, over 52% of the land mass is degrading globally and 20% has already degraded.
Table 6: Extent of agriculture/grasslands in the world in the year 2000

i. Pasture lands degradation
This includes 73% of the 34.5 (excluding 0.5 of feed crops) million Km2 of the pastures and rangelands in dry areas. This phenomenon is explained mostly by: (i) overgrazing, compaction and erosion in Asia, and (ii) pasture area expansion in Latin America (e.g. Amazon in Brazil). This long shadow of livestock production on the grasslands has affected 23 of the 35 global hotspots for biodiversity loss. It also consumes 8% of the global freshwater supplies.
ii. Pasture lands degradation in India
India has only 3.9% of its area under pasture lands but 15% of the world’s animal population. About 5% of additional areas are already wasteland but used as open pastures. Eighty per cent of India’s pasture lands are already degraded as 90% of about 536 million livestock (20th Livestock Census, 2019, and growing at a rate of 4.8%/year) graze extensively, thereby further turning pastures into wastelands.
iii. Pasture land’s socio-economic contributions
Pasture/Grasslands constitute (70.5% of agriculture areas) the main basis for livestock production, providing livelihood to over 1.3 billion people of the 8 billion world population, out of which about 1 billion are poor. They represent about 40% of the agricultural gross domestic product (GDP) (representing 1.5% of total GDP) and almost 30% of the world’s economic output. Also, 33% of the world’s protein intake is from this sector. With the urban population projected to increase from the present 50% to 60% by the year 2030, the demand for grasslands is going to increase further.
Emissions by various livestock production cycles on pasture/grasslands
The livestock production cycle entails various on-farm and off-farm activities which produce CO2, CH4 and N2O contributing to global GHG annually. Fig. 1 shows these emissions for different activities in the cycle on a global basis.
As we can see, the significant sources of GHG emission in Gt CO2 eq are – 34% from deforestation for creating pasture lands, 25% from enteric fermentation in animals as methane and a total of 30.5% from manures as both methane and nitrous oxide. Thus the major focus to reduce GHG emissions from livestock activities should be on: (i) reducing deforestation for pasturelands, (ii) limiting enteric fermentation in animals (which is 54.6% in India) and, (iii) managing manures and fertilizer better (contributing 2% globally but in India, it is 6.7%) (Fig. 1; Table 5).
Livestock activities emit almost 4.6 (7.1 including land use change) GtCO2eq/year of GHG globally, a majority (70%) of which is from extensive grasslands (Table 7). Intensive livestock production contributes only 30% of it. Also, only 38% of livestock-produced emissions are in CO2 form (vis a vis a total of about 60% present in the 0.05% of GHG in the atmosphere) while 31% each are methane and nitrous oxide. Thus, free animal grazing on rangeland (extensive systems), manure and fertilizer management in addition to halting deforestation for pasture lands (and for any other use) should receive priority for GHG reduction from animal activities. Intensification of livestock production systems will reduce pressure on pasture lands thus producing less GHG.
The global GHG net emission by livestock includes 9% at the production level (7% by land use changes i.e. forest conversion for pastures). It increases to 18% during the entire livestock system’s life cycle. This includes 65% of N2O mostly from manure, 37% of CH4 as part of agriculture sector emission and 64% of anthropogenic ammonia emission which directly contributes to acid rains. Incidentally, this level is higher than the emission of the entire road transport sector.
Table 7: Livestock activities life cycle impact on GHG emissions
| Type of GHG emission in livestock activities globally | Approximate annual emissions, GtCO2eq/year (figures with (*) include land use and changes category) | |||
| Extensive systems | Intensive systems | Total | % of Livestock total of (7.1*) | |
| CO2 | (1.8) | 0.13(0.9*) | 2.7 | 38 |
| CH4 | 1.77 | 0.4 | ≈2.2 | 31 |
| N2O | 1.4 | 0.8 | 2.2 | 31 |
| Total emissions from Livestock activities | 3.2 (5*) | 1.4 (2.1*) | ≈4.6 (7.1*) | |
| % emission by livestock activities | 70 | 30 | ||
Recent changes in the livestock sector impacting grasslands and livestock activities
With the increase in purchasing power of people in emerging countries especially, Brazil, China and India, there has been an increase in the consumption of meat and milk. This trend is expected to continue for the next decade or two (FAO, 2006) and exacerbate the problem of GHGs.
Since the year 1970, worldwide meat production has increased by three folds and milk production has more than doubled to 337 (carcass weight eq.) and 906 million tons, respectively. Since 2000, while an increase in developed countries in meat production (Fig. 2) was modest, 50% of the increase came from China, mostly in the form of poultry and pigs. In milk production, while developed countries are expected to make strides (Fig. 3), 33% of the increase in milk production was achieved by India amounting to the highest production (22%) in the world. These have resulted in: (i) deforestation of the Amazons in Brazil for meat, and (ii) continued degradation of pasture lands in India since both countries practice extensive free grazing. In developed countries, however, the increase in production is achieved through intensification and industrialization. The US-EPA (2014) report on IPCC Land Use, Land-Use Changes and Forestry category for 2012 in the USA, shows a decrease of 0.1 million Km2 (out of a total of 8.03 million Km2 of all land uses) of agricultural and pasture lands. Converted to forestry, this resulted in net carbon sequestration of 2.3 million tons. From 1990 to 2012, about 10 million Km2 areas of crop and grasslands are reported to be converted to mainly forestry and some to settlements. However, satellite image analysis for the USA shows that almost 0.03 million Km2 (77% from pasture lands) was converted to croplands (corn and Soybean) for bio-fuels between 2008-2012. Thus, the biofuel policy has implications for GHG emissions as it is often at the cost of pasture lands in the USA. Even though these crops also sequester carbon, it does so less than the grasslands (potentially 0.5-0.8 verses 1.7 Tons/ha/year C eq) due to much less soil organic matter (SOM) incorporation.
Agriculture lands GHG sequestration potential
The land mass acts as a GHG sink. The agricultural areas (including grasslands and wastelands) have the potential to sequester 26-31% (Table 8) of the 80 (+/-6.6) Gt CO2eq net anthropogenic GHG emissions gap/increase (Table 2) including 50% and 60% of global CH4 and N2O, respectively. This is depending on the management practices used to rebuild soil organic matter/carbon (SOM/SOC). There are also some considerations on the potential of the world’s agricultural areas (including grasslands) carbon sink capacity to be almost 50% of the global GHG net emissions. This is by use of recommended technologies/practices to manage them well depending on soils and their management, climate, rehabilitation (and intensification) of pasture and wastelands, livestock feed/manure/fertilizer management etc. Pastures can contribute, on average, up to 30% to the agricultural sector sequestration potential if managed well, including through further intensification. Some experts estimate the GHG sequestration potential of grasslands to be 10-34% (counting on and off-farm) based on their data for European conditions which are well within the range of an average 30% of agricultural lands globally.
Table 8: GHG Sequestration potential of agricultural and grasslands (FAO, 2014)
| Items | GHG Sequestration potential, % |
| Overall Agriculture sector GHG on-farm emissions sequestration potential, | 26-31 % of Global GHG |
| Global GHG sequestration average potential of grasslands(all climates) | Average 30% of
Agricultural Sector GHG |
|
≈10-34% of the Agricultural Sector |
Profitability of Sustainable Land Management (SLM) practices
Overall, in addition to storing soil carbon, SLM practices can be beneficial to farmers because they can increase yields and reduce production costs. Total profits to farmers by the year 2030 are estimated to be US$105 billion for Africa, US$ 274 billion for Latin America, and US$ 1.4 trillion for Asia using a landscape/watershed approach, however, it requires significant upfront investments of the order of US$ 20, 41, 131 billion, respectively (World Bank, 2012) in 2012 value.
To conclude…
*Retired International Senior Natural Resources/Watershed Management and Operations Officer of the FAO-UN on global postings across continents.


