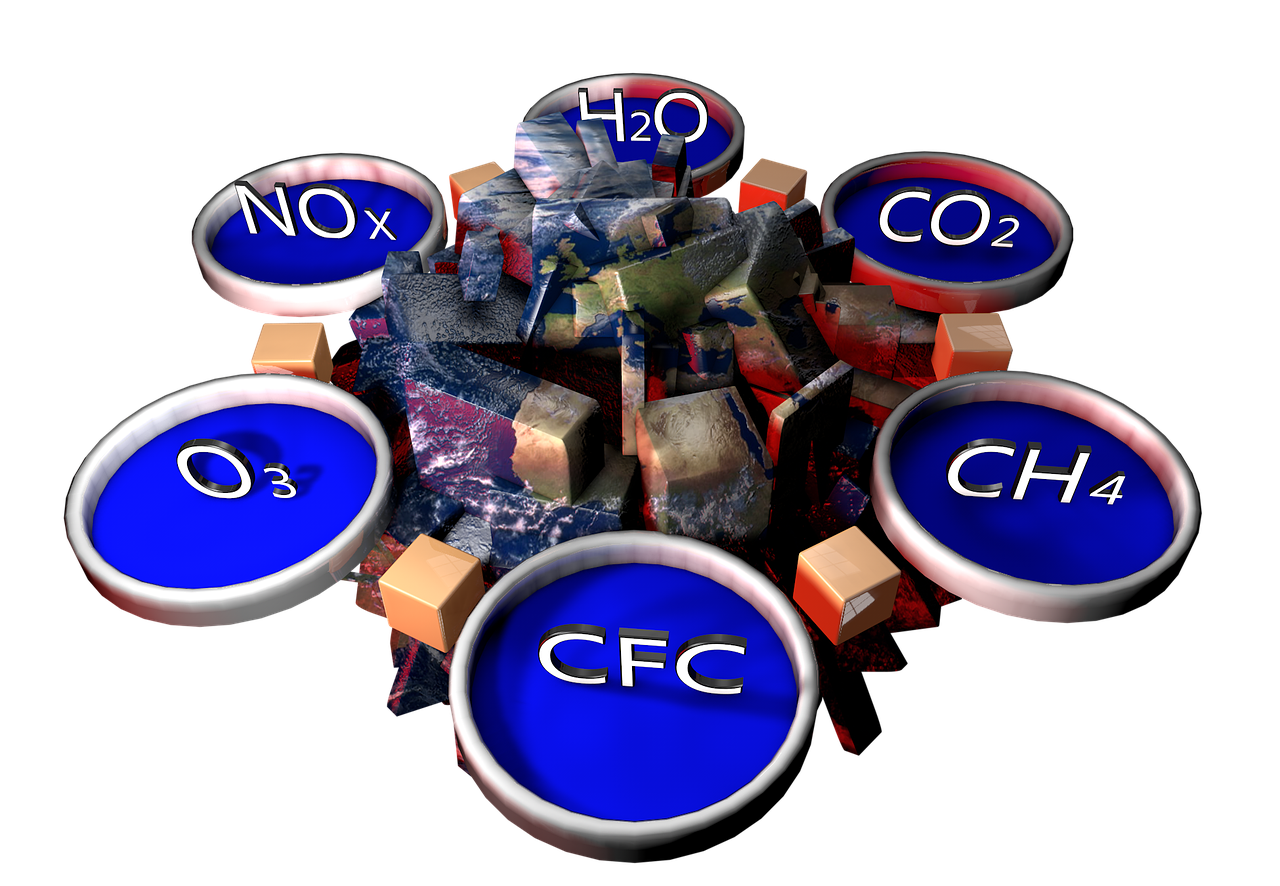
Our land is the biggest sink but its resource degradation is contributing 18-24% of the greenhouse gases (GHGs). However, the average GHG sequestration potential of well managed agriculture sector can be up to 30 % of the present-day anthropogenic annual GHG emissions of about 0.6-1 Giga Tons/year. The agriculture sector management consists of the management of land use changes, intermittent (rather than flooded) rice production, appropriate fertilizer use, appropriate livestock/compost and extensive pasture lands management on a watershed.
Watershed management is a holistic approach that strives to achieve the agriculture sector’s GHG sequestration potential where water plays the most critical resource.
In all watershed management or natural resource management programmes, socio-economic and other environmental benefits to farmers and society, are well quantified. However, their impact on Carbon sequestration has never been quantified.
This article aims to provide a methodology for the estimation of the number of GHGs (CO2, CH4, NO2 & HFCs) sequestration by watershed management consisting of the activities around a small reservoir.
The methodology provided here makes an effort to give a tool in the hands of practitioners to start doing so. This will make everybody realize the contribution being made by such programmes in arresting climate change. Hence, let us do so in future.
In addition, it will help increase the income of farmers once carbon credit schemes recognize it is their contribution to the earth’s atmospheric greenhouse gas (GHG ) reduction. It will help decision-makers to correctly redirect the scarce monetary resources being allocated to arrest climate change.
Methodology for estimating GHG sequestration around a small reservoir or water body
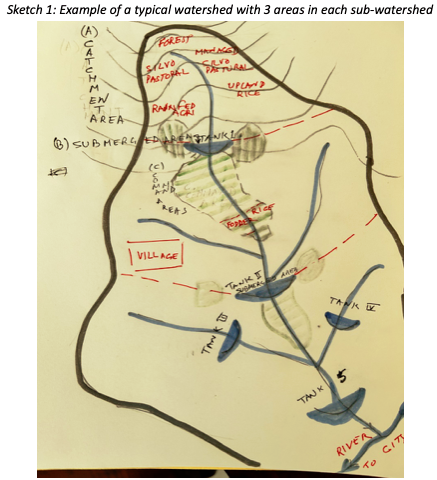
A watershed can be divided into 3 parts around a small reservoir (sketch 1) on a drainage line or rivulet as in Sketch 1:
(A) Upper catchment or Upper watershed area: Area from the top of the watershed contributing water to the small reservoir.
(B) Submerged area: Maximum area under water submergence of a small reservoir.
(C) Command area: Area which receives the irrigation or better moisture regime under or around a reservoir.
(A) Upper Catchment Areas
To estimate GHG sequestration in Catchment Area (A) first, areas under different land uses are determined. In a small watershed, these can be based on land surveys. Also, community lands can be taken from village records while privately owned areas are also well known to farmers. The changes seen in land use are recorded annually on the maps. For larger areas of a river valley satellite maps can be used for land use area estimation.
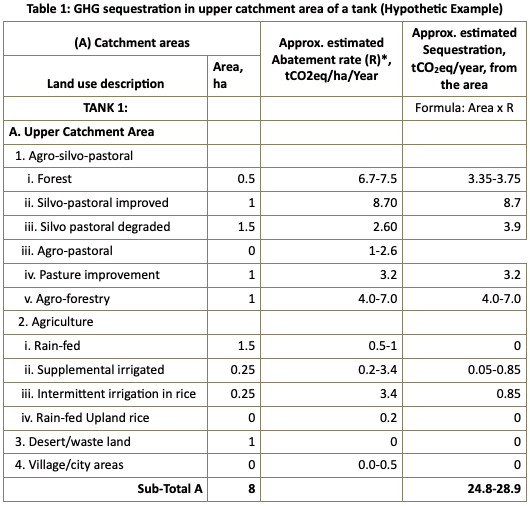
To estimate Carbon or Carbon dioxide equivalent (Ceq or CO2eq) sequestration from each land use, abatement rates are used. In the absence of the availability of India-specific abatement rates, those compiled by the World Bank in 2012 can be used. Then CO2eq sequestration is calculated by multiplying different land use areas with abatement rates. These are then summed up to get at the CO2eq sequestration from the upper catchment area of a small reservoir.
Table 1 makes these calculations for a hypothetic example. It is self-explanatory. In this example, about 25-29 tCO2eq is sequestered from a small catchment area of about 8 ha above a small pond of 1 ha-m capacity with 1 ha submerged area. Once a water body is created, upper catchment area land use also changes as more and more farmers start to stall feeding thus reducing animal density on public pasture lands. This helps in their faster regeneration compared to earlier.
(B) Submergence Areas of a Reservoir
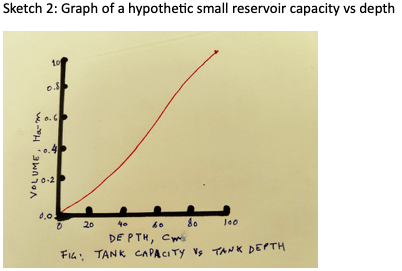
Areas under maximum water level or spillway crest level are determined by marking the contour line at crest level. Soon upon construction of a water body, 10 cm interval contour maps from bottom to crest level are made and the anticipated volume of water is calculated by multiplying the average of each two areas by 10 cm depth and summing them up. In the absence of such contour maps prepared in the beginning, the same can be mapped by marking the contour lines as the receding water line after a reservoir is full till it is dry. In old reservoirs or where water never dries, rough estimates of the volume filled by silt are made first. Then the rest of the submerged area requires surveys to make 10 cm interval contour maps. For ponds always holding some water, receding water line mapping is done. Then the volume versus depth of water graph can be prepared to know the volume of water or volume of silt deposition in a reservoir.
Sketch 2 shows such a graph. This is then used for estimating annual silt deposition in the reservoir bed, or volume of water in the reservoir at a given time.
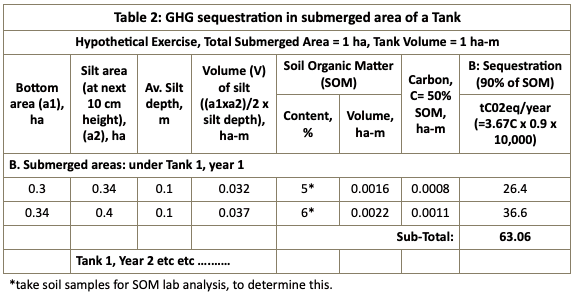
Each year soil samples at each of the 10 cm depths should be taken for lab analysis of the Soil Organic Matter (SOM) content in it. About 50% of SOM is carbon (C=3.67CO2). Even in small areas, some SOM is lost to air while being transported by erosion, however, at least 90% reached the reservoir bottom. Thus, the CO2 sequestration by soil erosion will be:
Where;
C=Carbon, tCeq = 50% of V of Soil Organic Matter (SOM)
Volume of silt, V = (a1xa2/2) x depth of silt, ha-m
a1 and a2 = bottom and top areas of silt in a reservoir at 10 cm intervals, ha
In this example, about 63 tons of CO2 gets stored in the reservoir in the first year, if the silt deposit was only an average of 20 cm in a 1 ha-m capacity reservoir whole bottom area (a1) is 0.3 ha and the top years at each 10 cm is 0.34 and 0.4 ha.
(C) Command Area
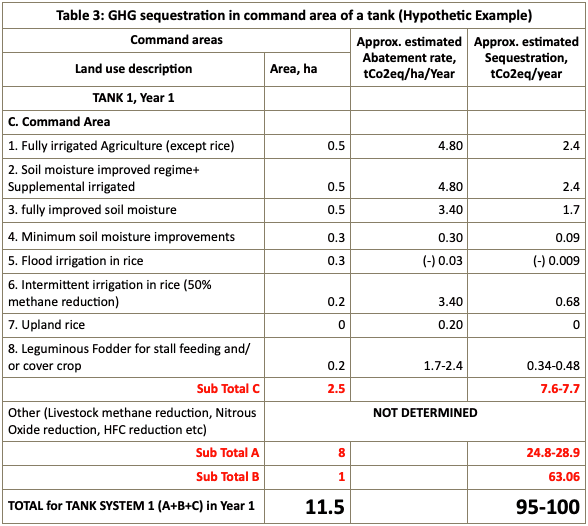
Under a water resource body, a combination of agriculture is practised, fully irrigated, supplemental irrigated, on enhanced soil moisture regime etc. While rice may not be very suited to the climate, its production starts either by flood irrigation or by intermittent irrigation to reduce methane production. Sometimes farmers also reclaim areas above a reservoir to irrigate by pumping, such areas are to be included in the command area. The amount of CO2 sequestration is calculated simply by multiplying different improved land use areas with their abatement rates as demonstrated in Table 3 as a hypothetic example. Hence CO2 sequestered in the command area is about 7.5 tons. To reduce animal pressure on upper pasture lands, the most important is fodder production for stall feeding.
Other GHG emissions
There are other aspects of methane reduction e.g. better livestock management, better compost management, better fertilizer management by using integrated fertility management, better water management, in-situ soil and water management etc that have not been included here. It takes a few years before farmers come to more advanced practices.
Overall CO2 sequestration on a small watershed
By totalling sequestration from all the above 3 areas, we arrive at the total sequestration by watershed management. In this hypothetical example, it comes to 95-100 tons (Table 3) in the first year from a small watershed of 11.5 ha with a small pond of 1 ha-m capacity and catchment area of only 8 ha and a command area of 2.5 ha.
If a cascade of such small ponds is made from top to bottom on a rivulet or rivulets leading into a bigger river, summing up the C sequestration of each of the small watersheds will give total Carbon sequestered. On larger watershed areas, satellite images for the determination of different land use areas can be used to cross-check or ground truth this proposed methodology.
Carbon credit and its economic value
The present market rate of Carbon credit fluctuates around $63/ton of CO2 sequestered. However, in India, the present rate offered is $20-50/ton depending on sources of emission and its disposal. Thus the total sequestration of 100 tons/year of CO2eq is equal to a minimum of $2,000 to 5,000 per year from this small watershed of 11.5 ha in the hypothetical example with a small pond of 1 ha-m. Depending on the number of farmers in a small watershed, Carbon credit generated can be apportioned. The introduction of such a scheme of carbon credit purchase for watershed management is the need of the hour, just like it is being practised for afforestation.
The average global temperatures have already increased by around 1.1-1.2°C above the pre-industrial (circa Years 1800) levels of 14-15°C. It is projected to increase by up to 2.8°C (against a target of 2°C) by the year 2100 if all presently Nationally Determined Commitments (NDCs) to arrest climate change are fully implemented globally. These NDCs concentrate on energy, transport and infrastructure sectors and do not much focus on the potential of the agriculture sector to arrest climate change.
*Dr. Prem Sharma is an Agricultural Engineer with a Master’s in Soil and Water Conservation Engineering from the Indian Institute of Technology (IIT), Kharagpur, and a Doctor of Philosophy (PhD) in Water Resources Systems Engineering from the University of California. He joined FAO/UN in 1985 and worked as an International professional till 2017 heading various National and Regional Participatory Natural Resources/Watershed Management and Food Security Programmes. He advised FAO teams in many countries till 2017.





Dr. Prem Sharma, Appreciate the way of calculating the impact on GHG absorption by small ponds or water shed ponds. It means, the old age water management modalities of India was automatically helping in management of GHGs. Does it mean we need to rework out the olden practices and the so called the modern ways urbanization is certainly faulty and we may have again to adopt the village based economy in place of present thrust on urbanization.
Great that your model of calculation may be used to quantify the impact of open-air olden times water management techniques. Congratulations for an excellent paper and presentation.
Yes, traditional as well all other water resource systems form a basis for GHG sequestration by enhancing it and directly trapping carbon in the SOM. The problem started and continues to be made worst by fossil fuel use and deforestation. Water resources help arrest it.