
India Updates Trade Indices to FY23 Base
New Delhi: The Directorate General of Commercial Intelligence and Statistics under the Ministry of Commerce and Industry has revised the base year (BY) of India’s Merchandise Trade Indices to financial year 2022–23, replacing the earlier base of financial year 2012–13, in an effort to align the series more closely with the country’s changing trade composition, global supply chain shifts and contemporary macroeconomic frameworks.
Merchandise Trade Indices are compiled to measure changes in the unit values, or average prices, of India’s exports and imports over time. They serve as key indicators of price movements in the external sector and are widely used for macroeconomic analysis, including the compilation of national accounts, assessment of terms of trade, evaluation of balance of payments trends and analysis of international price competitiveness. With technological changes, the emergence of new commodities, restructuring of global production networks and shifts in relative prices over the past decade, the earlier base year was considered less representative of the present trade basket.
The revision to financial year 2022–23, with 2022–23 taken as 100, follows the recommendations of a committee constituted by the Directorate General of Commercial Intelligence and Statistics under the chairmanship of Nachiketa Chattopadhyay of the Indian Statistical Institute, Kolkata. The committee examined the existing methodology, data coverage, weighting structure and compilation practices, and proposed refinements in line with international best practices to enhance statistical robustness, coherence and alignment with other updated macroeconomic indicators.
The revised series incorporates an updated commodity basket at the Principal Commodity level to better reflect emerging and declining items in India’s export and import profile. Weights have been recalibrated using trade values of the new base year to mirror the latest value shares in exports and imports. The Directorate General of Commercial Intelligence and Statistics has retained the Laspeyres index formula, with weights fixed across time, but has strengthened procedures relating to the selection of a common commodity basket for the base year and the imputation of missing unit values during base year construction.
The series provides monthly, quarterly and annual Export Unit Value Indices and Import Unit Value Indices. It also includes trade indices by Principal Commodity classification, Standard International Trade Classification and Broad Economic Categories. In addition, bilateral and region-wise trade indices are compiled for India’s top 20 export and import partner countries, along with measures of gross terms of trade, net terms of trade and income terms of trade.
Preliminary data for the financial year 2025–26, covering April to November and calculated with the financial year 2022–23 as the base, indicate fluctuations in both price and volume movements. The Export Unit Value Index stood at 105.31 in April 2025, moderated to 96.31 in June and rose again to 105.32 in November. The Import Unit Value Index showed sharper variation, declining to 91.74 in June before increasing to 110.17 in October and easing to 106.59 in November. On the quantity side, the Export Quantity Index reached 116.19 in October and 113.06 in November, while the Import Quantity Index remained elevated through much of the period, peaking at 138.16 in April and 137.04 in October.
The Unit Value Index measures the percentage change in the average unit value of items traded in a given month relative to the same month in the base year. For example, an index of 120 implies that if the average unit value in the corresponding base year month was 100, it has risen to 120, representing a 20 per cent increase. The calculation involves two successive stages of weighted averaging. First, indices are computed for individual items within each Principal Commodity group. Second, these are aggregated across Principal Commodity groups to derive the overall index at the national level. In both stages, weights are proportional to trade importance in the base year and are fixed across time, with twelve distinct sets of monthly weights applied to preserve seasonal trade patterns.
The Quantity Index is derived by dividing the Value Index by the Unit Value Index, thereby isolating volume changes from price effects. If export value increases 2.4 times while unit values rise 1.2 times, the implied increase in physical quantities would be roughly twofold. However, unusually high or low quantity indices may partly reflect base effects rather than pure volume shifts.
The Directorate General of Commercial Intelligence and Statistics has clarified that comparability is most meaningful when indices for the same month are compared across different years, since monthly weights differ across the twelve months. Where items present in the base year basket are not traded in a given current month, their weights are redistributed proportionately among traded items. For instance, if three commodities carried base-year weights in the ratio 50:100:50 and one commodity is absent in the current month, its weight is reallocated to the remaining commodities in proportion to their original shares. The comparability of indices, therefore, depends in part on the similarity of traded baskets across months.
The revised framework strengthens the analysis of terms of trade. Net terms of trade, also known as commodity terms of trade, are defined as the ratio of export prices to import prices. A decline in export price indices alongside a rise in import price indices would signal deterioration in net terms of trade, implying reduced purchasing power of exports. Conversely, stronger export prices relative to import prices indicate improvement. Gross terms of trade measure the ratio of physical quantities of imports to exports, reflecting volume relationships. Income terms of trade combine net terms of trade with export quantities, capturing the purchasing power of exports in terms of imports and providing a broader assessment of trade gains.
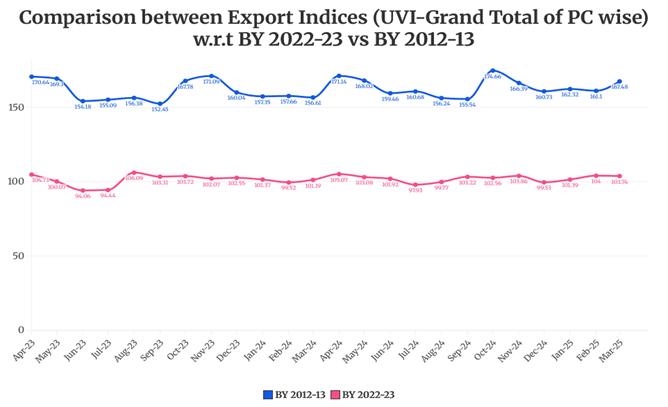
To ensure continuity and facilitate analytical transition, comparative indices under both the earlier 2012–13 base and the revised 2022–23 base have been provided for financial years 2022–23 and 2023–24. This back-series comparison allows users to assess differences arising from updated weights and commodity composition.
The revised indices will be released on the official website of the Directorate General of Commercial Intelligence and Statistics, accompanied by detailed methodological documentation in the committee’s report. The data are extensively used by the National Accounts Division of the Ministry of Statistics and Programme Implementation as deflators in estimating real exports and imports for gross domestic product compilation. The Reserve Bank of India relies on them for external sector assessment, balance of payments analysis and evaluation of price competitiveness. Various ministries, government agencies, research institutions and academic bodies also use the indices for policy formulation, empirical modelling and study of trade dynamics.
Officials stated that the revision is intended to enhance relevance, reliability and analytical usefulness in a rapidly evolving trade environment, ensuring that the Merchandise Trade Indices remain aligned with India’s current trade structure and integrated global engagement.
– global bihari bureau