Hispanics Launch 36% of New Biz, But Scale Lags Asians
Indian Tech Surge Outruns Chinese Scale
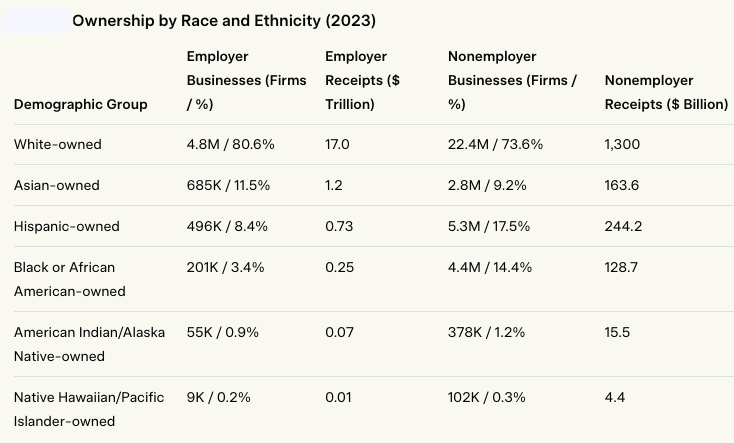
Washington: On November 20, 2025, the U.S. Census Bureau delivered its most detailed portrait yet of who really owns American business. The ownership picture is heavily concentrated. White owners control 80.6 per cent of employer firms (4.8 million) and 74 per cent of employer receipts ($17 trillion). Women own 42.3 per cent of nonemployer businesses (12.9 million, $423.1 billion) but only 22.9 per cent of employer firms (1.4 million). Veterans hold 4.4 per cent of employer firms (261,000) and generate 2 per cent of receipts ($1.0 trillion total). The nonemployer sector, 30.4 million firms producing $1.8 trillion, remains the primary entry point for most underrepresented groups, yet median receipts stay below $50,000 and conversion to employer status is the single largest barrier—exacerbated for Black and Hispanic owners, where average nonemployer receipts lag at $22,000–$36,000 versus $48,000 for Asians and Whites.
Historical trends amplify these disparities. From 2007 to 2012, Asian subgroups grew at double the national rate: Asian Indians up 38.2 per cent, Chinese 48.1 per cent, Koreans 22.1 per cent—versus Hispanics’ 34 per cent from 2007–2019 and Black firms’ 64.5 per cent in nonemployers from 2002–2007. The ABS methodology, linking IRS records to census demographics for 100 per cent nonemployer coverage and sampling 350,000 employer firms annually (with <2 per cent error), ensures robustness but highlights self-reporting risks and multi-owner complexities defaulting to primary demographics.
Geography reinforces the pattern. The fifty highest-income congressional districts average 28 per cent minority-owned employer firms; the fifty lowest-income districts average 6 per cent. Districts such as CA-17 (Fremont–Sunnyvale) contain more Asian Indian technology companies than thirty-eight entire states contain Black-owned employer firms, while Southern metros like Atlanta (strong Black health care presence) and Houston (Hispanic construction hubs) show surges but lag Asian coastal dominance—California and New York alone account for 59 percent of Chinese firms, 37 percent of Asian Indian, and 46 percent of Korean.
Urban-rural splits further illuminate inequities: minority employer ownership averages higher in urban areas (25–30 per cent) than rural (under 10 per cent), with Asians overrepresented in tech-heavy metros and Hispanics/Blacks in service/construction Sun Belt pockets. Receipt sizes bin analysis shows Asians skew larger ($1–5 million brackets), while Black and Hispanic firms cluster under $100,000, underscoring capital’s role in expansion.
Among the 36.4 million firms that together generated $50 trillion in 2023 receipts, one rivalry stands out: Asian Indian and Chinese entrepreneurs, the two largest and most successful Asian subgroups, are no longer just participants in the American dream; they are reshaping it, but in markedly different ways.
Layered into this dynamic is the story of Korean American entrepreneurs, a third pillar of East Asian success that punches above its demographic weight through resilient, community-driven models, yet trails the others in raw scale and high-margin velocity. Running parallel, and in many respects outpacing all others in sheer creation, is the Hispanic entrepreneurial surge, a demographic engine that now accounts for more than one in three net new businesses yet remains sharply constrained when it comes to scaling into employer firms. Bringing up the rear in scaling but showing remarkable momentum in entry-level formation is Black entrepreneurship, where a 57 per cent rise in employer firms from 2017 to 2022 has outstripped national growth rates, yet persistent barriers keep representation far below population parity and receipts disproportionately low.
The data, drawn from the 2024 Annual Business Survey (ABS) for employer firms and the 2023 Nonemployer Statistics by Demographics (NES-D) for solo operations, underscore these trajectories with precision. Employer firms, numbering 5.9 million and accounting for the bulk of economic activity with implied receipts approaching $23 trillion, represent structured enterprises with payrolls and hierarchies. Nonemployer firms, at 30.4 million and generating $1.8 trillion in receipts, capture the gig economy’s freelance consultants, side-hustlers, and small-scale operators filing at least $1,000 in federal taxes annually. This dual framework reveals not just volume but velocity: how groups convert initial ventures into job-creating engines.
Asian Indians operate an estimated 137,000 employer firms and 560,000 nonemployer operations, comprising about 20 per cent of the broader Asian category based on historical benchmarks from the 2012 Survey of Business Owners, where they held 19.9 per cent of Asian firms with $227.1 billion in receipts. Their average employer firm generates roughly $1.8 million in annual receipts (estimated, sector-adjusted), driven by concentration in high-margin sectors such as computer systems design (NAICS 5415), management and scientific consulting (5416), and ambulatory health care (621). This outperforms the national employer average of $3.9 million when adjusted for sector drag, with Indian firms posting 40–70 per cent higher receipts than Chinese counterparts in these areas.
Veteran Status: Veterans own 1.6 million businesses total ($1.0 trillion in receipts), with modest shares: 4.4% of employers (261,000 firms) and 4.5% of nonemployers (1.4 million firms, $65.7 billion). This stability across sectors suggests veterans’ entrepreneurial resilience, though their receipt share (2% overall) underscores untapped growth potential.
These figures highlight inequities: White owners dominate employer receipts (74% of the $23 trillion total), while minorities cluster in lower-receipt nonemployers. For instance, Black-owned nonemployers (14.4%) outpace their employer share (3.4%) by over 4x, pointing to access barriers like capital and networks.
The H-1B visa programme has been the decisive catalyst: capped at 85,000 new issuances annually but renewed extensively through exemptions, it selected for 72 per cent Indian approvals in recent years, creating a pipeline from corporate engineering roles to unicorn founders. This yields the highest nonemployer-to-employer conversion rate of any group, around 24 per cent (estimated from multi-year growth ratios), and a median firm age younger than the broader Asian cohort, reflecting post-1965 immigration waves that seeded the 1980s tech boom.
Chinese entrepreneurs maintain the largest absolute footprint among Asian subgroups, with roughly 187,000 employer firms and 756,000 nonemployer businesses—historically 27.3 per cent of Asian firms per 2012 data, generating $210.1 billion in receipts. Their average employer firm produces about $1.7 million in receipts (estimated), reflecting a heavy presence in accommodation/food services (22.2 per cent of Asian employers, with gross margins rarely exceeding 8 per cent) and retail trade. Yet scale translates into tangible impact: Chinese-owned firms employ more workers per firm on average, dominate supply chains in ethnic enclaves like Chinatowns, and benefit from transnational capital flows that are harder to track in official data. In absolute employment terms, they remain the largest job creators among Asian subgroups, with 48.1 per cent growth in firm numbers from 2002 to 2007—outpacing the national average by more than double—and continued expansion through diverse inflows like family reunification and student visas.
Korean Americans run approximately 85,000 employer firms and 300,000 nonemployer ventures, generating $130–140 billion in employer receipts annually—about 12.4 per cent of Asian firms historically, with $107.8 billion in 2012 receipts. Most operate in personal services (dry cleaning, nail salons) and small-scale retail, supported by family labour and rotating credit associations (kye), yielding average receipts of $1.6–1.7 million per employer firm and a conversion rate of 18–20 per cent (estimated from growth-adjusted ratios). While outliers like Fitbit (co-founded by Korean American James Park) and DoorDash demonstrate tech capability, 80 per cent remain in personal services and retail, giving Korean firms remarkable recession resistance: 22.1 per cent growth from 2002 to 2007 and 16.8 per cent from 2007 to 2012, sustained by post-1965 concentrated waves that built tight ethnic economies prioritising stability.
Hispanic entrepreneurs dominate new business formation: they accounted for 36 per cent of all net new firms in 2023—more than twice their 19 per cent population share—and now own more than 5 million businesses that generate roughly $800 billion in receipts and employ 2.9 million workers, up 34 per cent in firm numbers from 2007 to 2019. Foreign-born Hispanics show a self-employment rate of 14.1 per cent (versus 7 per cent for U.S.-born Latinos), powering rapid growth in construction (the sector with the largest number of Hispanic-owned firms, at 40,340 in 2020), retail, and food services, with a 44 percent rise in employer firms from 2017 to 2022 and 14.6 percent year-over-year growth from 2021 to 2022. Yet the scaling gap is stark: Hispanics hold 17.5 per cent of nonemployer firms (5.3 million, $244.2 billion in receipts) but only 8.4 per cent of employer firms (496,000, $730 billion—3.2 per cent receipt share), a threefold drop tied to capital droughts despite 8.2 per cent annual growth from 2019 to 2020.
Black entrepreneurs mirror Hispanics in explosive entry but face an even steeper scaling cliff. They own 4.4 million nonemployer firms (14.4 per cent share, $128.7 billion in receipts, up 5.6 per cent from 2017’s 2.95 million) and 194,585 employer firms (3.3 per cent of the total, $211.8 billion in revenue—up 66 per cent from $127.9 billion in 2017). Overall, Black-owned businesses surged 57 per cent in number and 66 per cent in revenue from 2017 to 2022, outpacing the national average and contributing to more than half of total U.S. business growth in that period, with foreign-born Black immigrants driving self-employment rates 2–3 times higher than U.S.-born Black Americans. Key sectors include health care (27.5 per cent of Black employer firms, or 49,872 firms) and professional services, yet the employer share remains just 2.7–3.3 per cent against a 14.4 per cent population slice, with receipts at only 1.1 per cent of the national total—a fourfold drop from nonemployer representation, compared to Hispanics’ threefold. Conversion rates hover at 10–12 per cent (estimated from growth-adjusted ratios), half of Asians’ 20–24 per cent, due to limited access to capital and networks, though nonemployer receipts grew to $83.6 billion in 2019 from earlier baselines.
Across the broader Asian category, 685,000 employer firms (11.5 per cent of the U.S. total) and 2.8 million nonemployers (9.2 per cent) produced $1.2 trillion in employer receipts—up from $863.3 billion in 2018—far exceeding the group’s 6 per cent population share (22 million in 2023). Between 2017 and 2023, the Asian employer share rose 1.4 percentage points, with Asian Indians driving two-thirds of that increase; Chinese and Koreans contributed steadily through 48.1 per cent and 22.1 per cent historical growth rates, respectively.
The data highlight five distinct models: high-skill visa selection and rapid scaling (Asian Indian), large-scale enclave networks (Chinese), community credit and family labour (Korean), demographic momentum with constrained capital access (Hispanic), and resilient entry amid historical barriers (Black). Each has produced measurable success—Asians’ $1.2 trillion receipts, Hispanics’ 36 per cent new-firm share, Blacks’ 57 per cent employer growth—but the differences in outcomes are equally measurable and largely traceable to policy-enabled pipelines and financing channels, from H-1B’s STEM focus to lending biases rooted in redlining.
Practical steps forward include establishing a $50 billion First Employee Fund to subsidize payroll taxes and benefits for initial hires, with priority for women-, Black-, Hispanic-, and rural-owned firms; reforming H-1B to reserve portions of the cap for startups and underrepresented founders while eliminating per-country green-card limits; designating the 500 lowest-performing congressional districts as enhanced Opportunity Zones with automatic loan guarantees and capital-gains relief; requiring demographic reporting and public rankings for significant federal contractors; expanding community development financial institutions modeled on proven ethnic credit systems with federal matching capital; and conditioning favorable carried-interest taxation on minimum investment in women- and minority-led companies.
The 2023 Census has provided the clearest map to date of who owns American businesses and where the bottlenecks lie. The challenge ahead is to extend the conditions that enabled the strongest performers to the millions still struggling to move from solo operation to sustainable employer. The data are in; the next move belongs to policy.
– global bihari bureau