Among the challenges the statisticians face is that farmers don’t always use standardized measures to quantify the crops or percentages to break down the various uses to which they are put. ©FAO/Andrew Esiebo
Gathering statistics on agriculture is worth a challenge in Liberia.
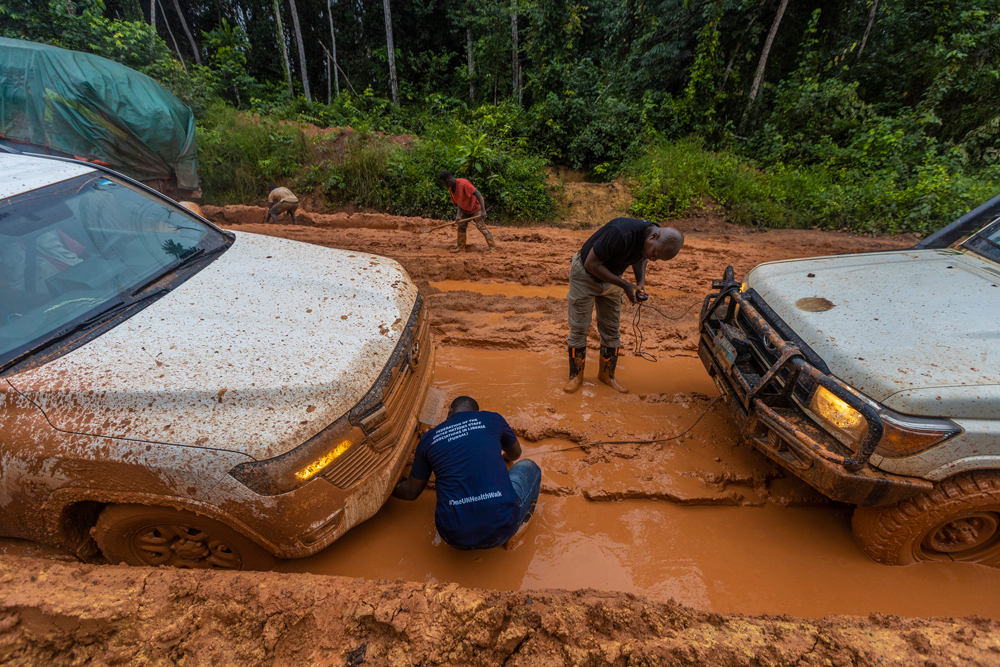
As a team of five travels to the southeast of Monrovia, the capital of Liberia, their two four-wheel drive vehicles slither to a halt for the umpteenth time. The route they’re travelling is one of the country’s major highways. But the seasonal rains have transformed it into a gooey morass of reddish-brown mud.
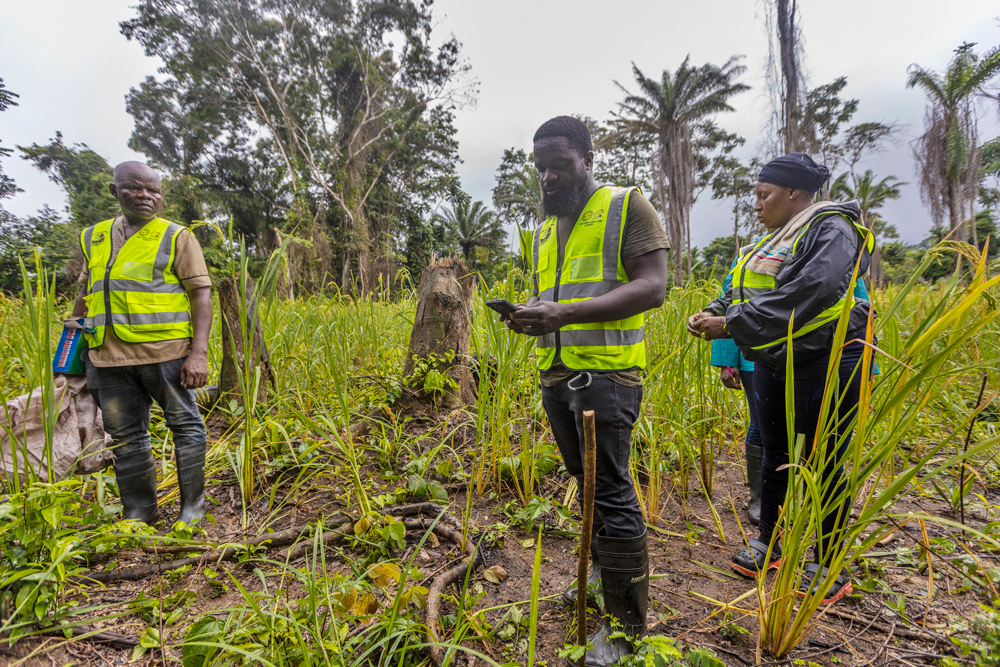
Finally abandoning efforts to push the cars, the team dressed in fluorescent yellow sets out on foot into the surrounding rainforest. It will take them two or three hours to reach the sites they are aiming for.

But just who are these characters in high-visibility jackets? Are they forest rangers? Park monitors? Game wardens? The answer might be unexpected, but they’re actually statisticians.
The team of five includes statisticians from the Food and Agriculture Organization of the United Nations (FAO) and staff from the country’s main statistical office, the Liberia Institute of Statistics and Geo-Information Services (LISGIS).
Knowing that this isn’t the first time a scenario like this has happened for the field statisticians, it almost seems like stating the obvious when LISGIS team leader, Anthony Dymacole, says that among the obstacles they face in surveying rural areas: “one of the most challenging is accessibility.”

Other obstacles that can and do get in their way are: security roadblocks, which can hold them up for days, flooded or broken bridges and even wild animals.
These might seem like extreme scenarios to face just for the task of gathering numbers. But its importance is actually hard to overstate. “If you don’t measure it, you can’t manage it,” says FAO Senior Statistician, Yakob Seid.
Measuring is, in fact, the goal of the 50×2030 initiative, which, as its name suggests, aims to support statistical surveys of agriculture in 50 African and Asian countries by the beginning of the next decade. Implemented by FAO, the World Bank and the International Fund for Agricultural Development together with governments, it has been rolled out in 26 countries so far.
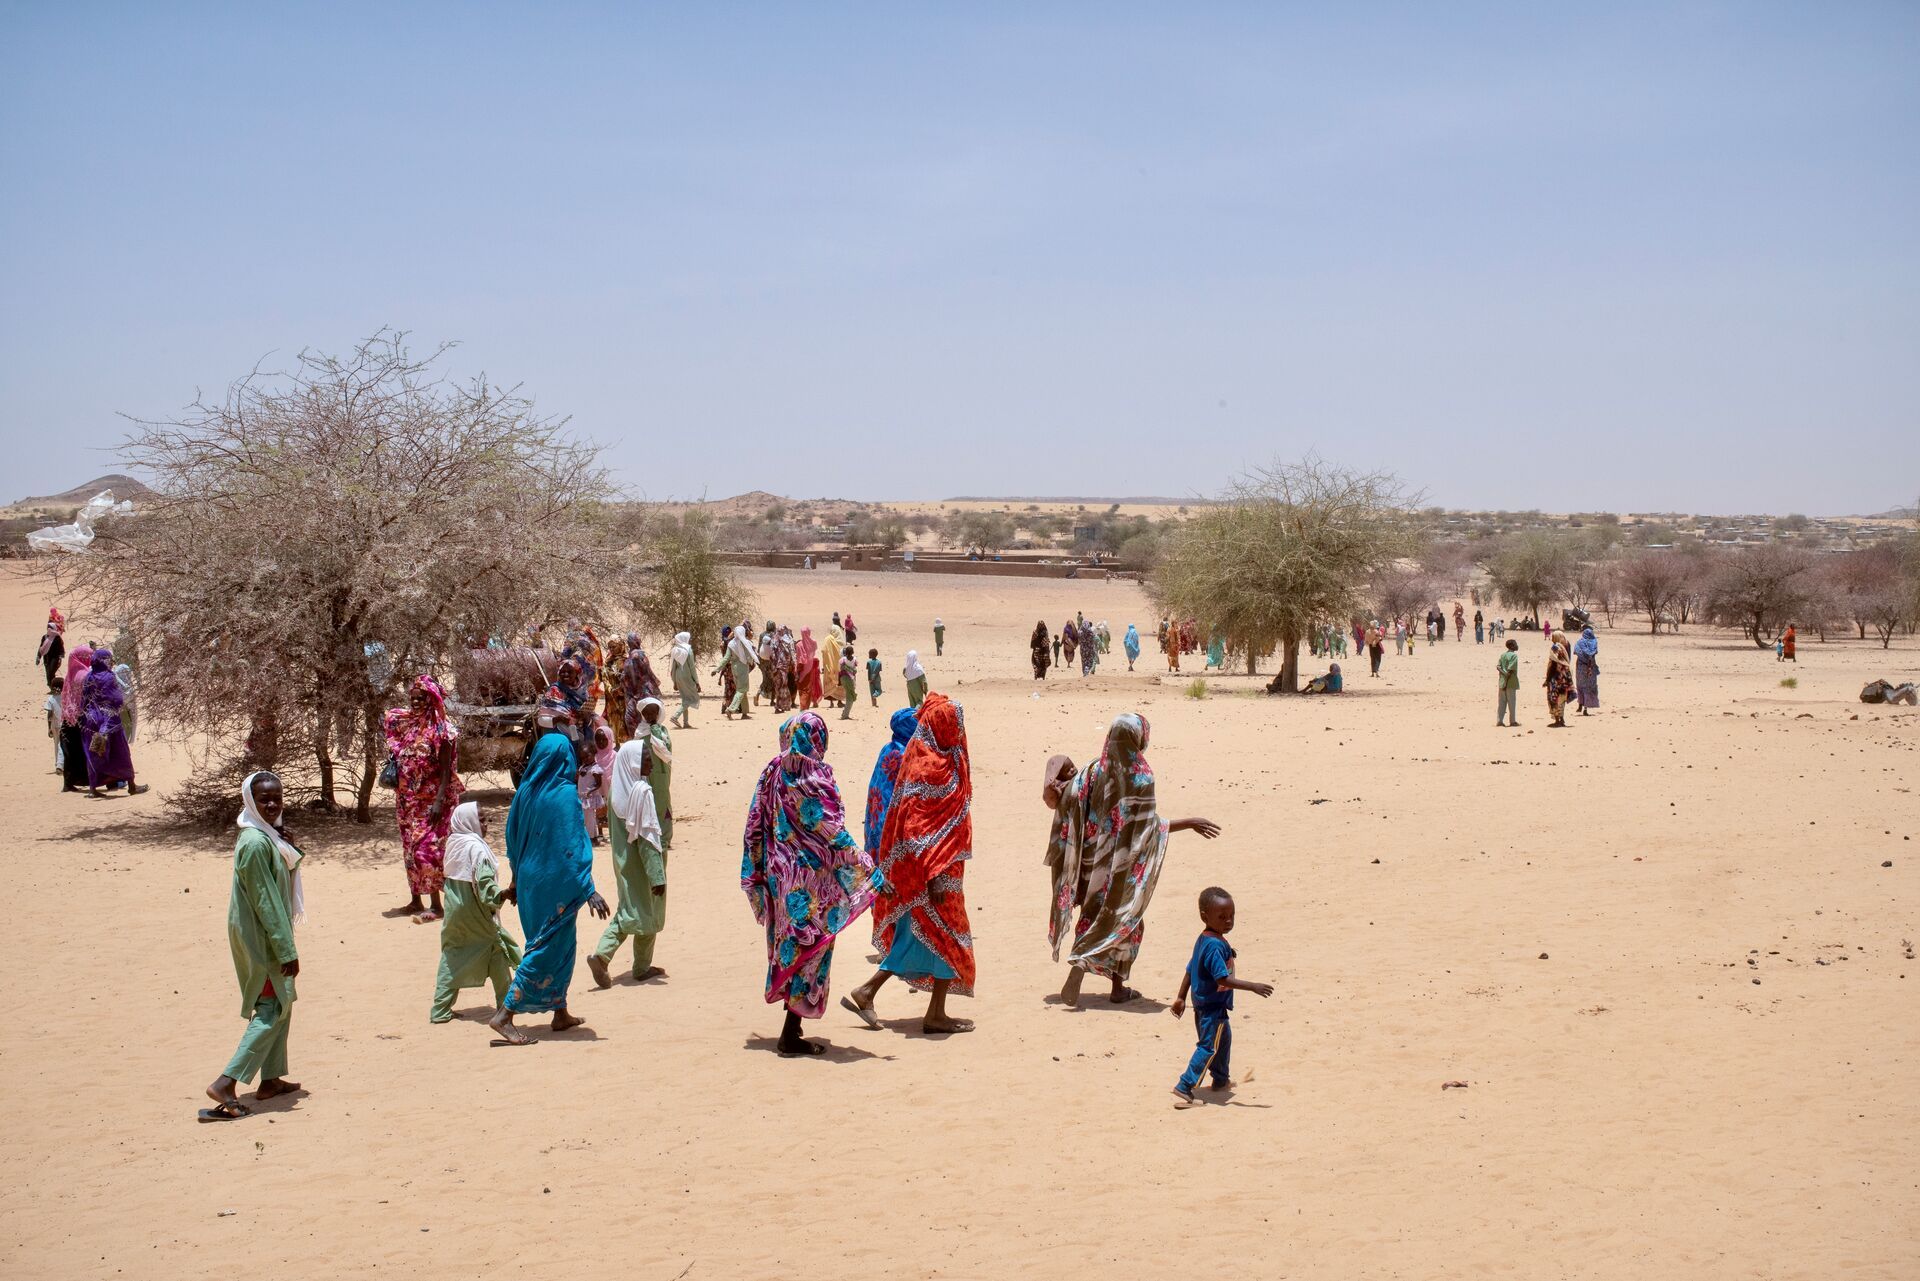
In most of these 50 low – and middle-income countries, agriculture is the main source of revenue and employment and makes a crucial contribution to Gross Domestic Product.
Governments and development partners including FAO are investing considerable resources in the agricultural sector in these countries, “however without proper data, we will not be able to measure how effective these resources are in improving people’s lives and livelihoods,” says Seid.
But what sorts of things do the teams of statisticians actually measure? Not surprisingly, among the focus areas are the quantity of crops the farmers produce, the area harvested, labour inputs and demographic characteristics of the workforce, machinery used, the impact on the environment and technology such as irrigation.
It may sound straightforward, but it’s not always that simple. For example, even when smallholder farmers have an overview of what they produce and what happens to it, many think in terms of baskets of grain or bags of vegetables instead of kilos of crops, making it challenging for the statisticians to record the data in terms which will align with national and international standards.

The team of statisticians, otherwise known as enumerators, often need to fall back on crop cutting, which involves taking a sample harvest from a small patch of a farmer’s field and extrapolating the resulting yield to the total area. To get an accurate picture of what proportion of the harvest goes to different uses, the statisticians often use a method called proportional piling – asking the farmer to make little piles representing the different uses to which the crop goes, such as family consumption, cash sales or paying the rent.
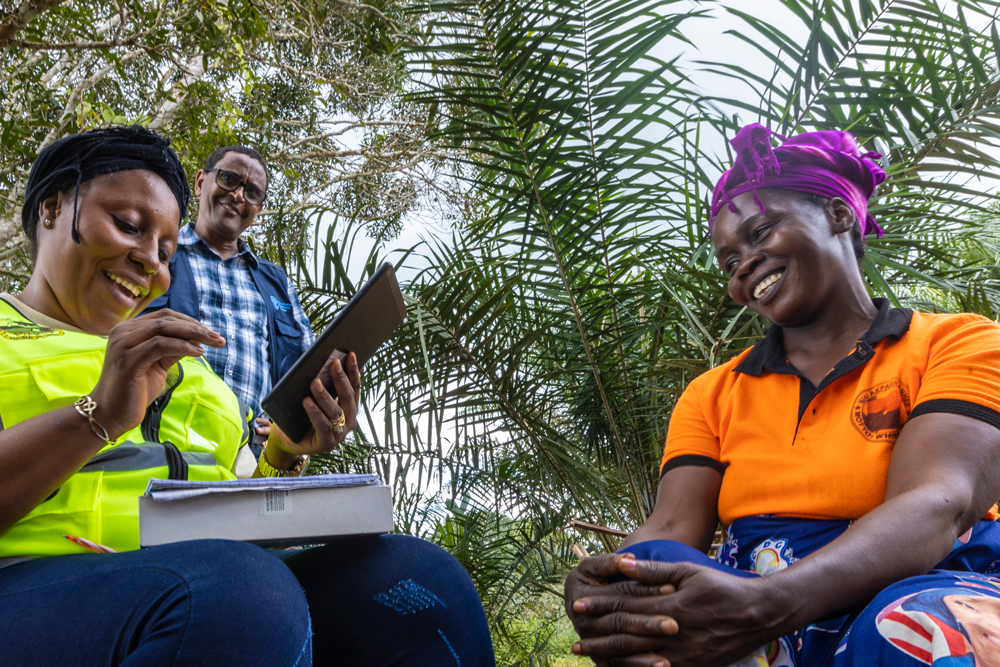
Susannah Tarway, a farmer who makes a living from growing cassava, potatoes and okra, says she’s confident the survey will “help me with my work … and send my children to school” given that the data can highlight needs such as for more fertilizer, which can then be addressed by the government or other partners, helping farmers to improve their families’ livelihoods.
In Liberia, as in many countries, the task of gathering this information is long overdue, with the most recent agriculture census carried out half a century ago using paper-based methods. Replacing these with computers to survey brings huge advantages, both in terms of speed and in terms of reducing potential errors, with the templates used by interviewers able to pick up on inconsistencies before they make their way into the data set.
But even tablets don’t solve all the problems. Transmission of data they have collected in the field to a central server still relies on mobile internet connectivity, which is non-existent in many areas, forcing survey teams to travel to the nearest place with mobile coverage. Until the data has been transmitted and checked, the enumerators’ mission will not yet be accomplished.
With FAO’s backing to complete the surveying work, Liberia and its statisticians will be in a stronger position to carry the vital measuring and data-gathering work forward in the coming years.
Accurate data is essential to help governments better understand the status of their agricultural sector, the areas that are flourishing and the areas that need further investment. The process is “not about collecting data for the sake of collecting data. It is to use the data for the service of big development objectives such as eradicating hunger and reducing poverty,” says FAO Chief Statistician and Director of the Statistical Division, Jose Rosero Moncayo.
With the support of FAO and its partners through the 50×2030 initiative, both the policymaker and the farmer are expected to be better placed to make the most of their resources for their countries and their own futures.
Source: The FAO News And Media Office, Rome
– global bihari bureau


