Net Migration Collapse Slows U.S. Population Expansion
Lower Migration Drives Slowest U.S. Growth Since Pandemic
Washington: A sharp fall in international migration drove a marked slowdown in U.S. population growth over the past year, with the country adding just 1.8 million people between July 1, 2024, and July 1, 2025, according to new estimates released Tuesday by the U.S. Census Bureau. The 0.5 per cent increase—the weakest annual growth since the early stages of the COVID-19 pandemic—came as net international migration dropped by more than half from the previous year, outweighing relatively stable birth and death trends nationwide.
The latest Vintage 2025 population estimates show the U.S. population reaching 341.8 million as of July 1, 2025. While growth remained positive, the pace slowed sharply from the previous year, when the nation added 3.2 million people and grew by 1.0 per cent, its fastest annual expansion since 2006. Census officials said the current slowdown mirrors levels last seen in 2021, when population growth fell to a historic low of 0.2 per cent during the height of the pandemic.
Also read: Grey Labour Surge Puts America on Demographic Tightrope
According to the Census Bureau, net international migration fell to about 1.3 million between July 2024 and June 2025, down from 2.7 million in the prior year, a decline of 53.8 per cent. Christine Hartley, assistant division chief for Estimates and Projections at the Census Bureau, said births and deaths changed little compared with the year before, making the drop in international migration the primary driver of slower population growth.
Natural change, defined as births minus deaths, totalled nearly 519,000 nationally during the same period, roughly in line with the previous year. Although this figure exceeds levels recorded earlier in the decade during the pandemic, it remains far below historical norms. In 2017, natural change was approximately 1.1 million, and between 2000 and 2010 it typically ranged from about 1.6 million to 1.9 million annually.
Slower growth was evident across most of the country. All four U.S. Census regions recorded population gains between July 2024 and July 2025, but each grew at a slower pace than in recent years. Every state except Montana and West Virginia saw growth slow or population decline deepen.
The Midwest was the only region in which all states gained population during the period. After experiencing population decline in 2021 and only modest growth in 2022, the region recorded solid increases in 2023, 2024 and 2025, adding roughly 260,000, 386,000 and 244,000 people, respectively. Census demographers said slight improvements in natural change in several Midwestern states contributed to the region’s recent growth.
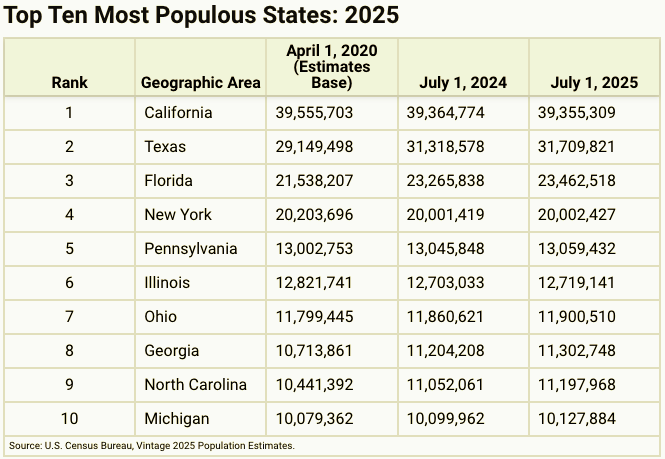
From July 2024 through June 2025, the Midwest also recorded positive net domestic migration for the first time this decade. While the net gain of about 16,000 people moving from other U.S. states was modest, it marked a significant turnaround from the substantial domestic migration losses recorded in 2021 and 2022, when the region lost at least 175,000 residents each year. Ohio and Michigan illustrated the shift, with Ohio posting a net domestic migration gain of 11,926 in 2025 after a loss of 32,482 in 2021, and Michigan recording a gain of 1,796 after losing 28,290 residents to other states in 2021.
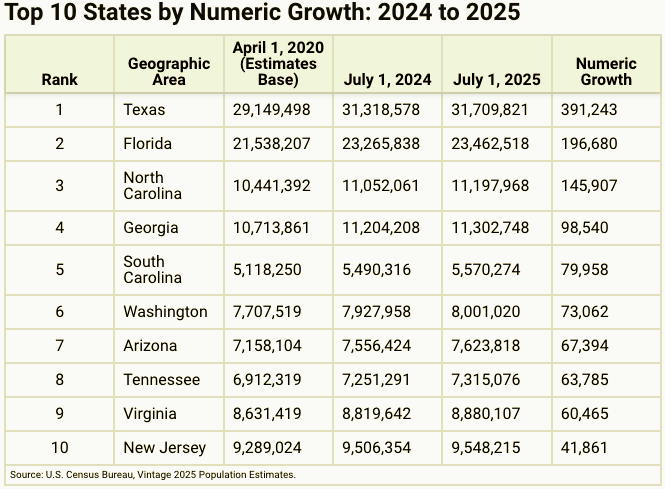
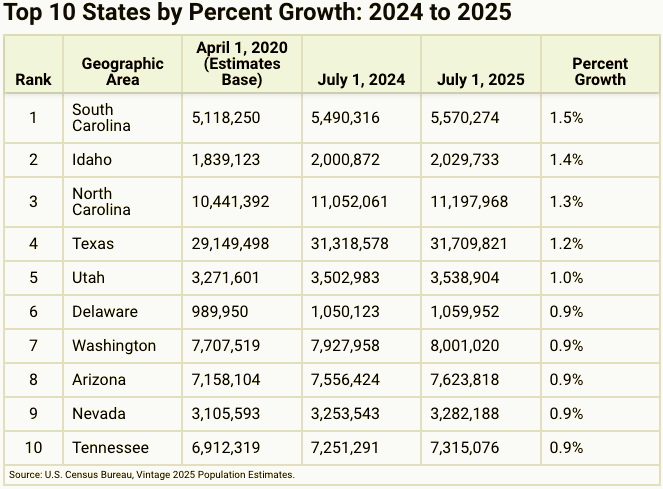
In the South, population growth remained strong but slowed noticeably. The region’s growth rate fell to 0.9 per cent between July 2024 and July 2025, down from 1.4 per cent the previous year and below 1.0 per cent for the first time since 2021. South Carolina emerged as the fastest-growing state in the country, with its population increasing by 79,958 people, or 1.5 per cent, largely driven by a net domestic migration gain of 66,622. While still the highest in the nation, South Carolina’s growth rate eased from 1.8 per cent in 2024.
Idaho and North Carolina followed closely, growing by 1.4 per cent and 1.3 per cent, respectively, with both states benefiting from domestic migration gains. Texas grew by 1.2 per cent, driven by a combination of natural change and net international migration, despite a sharp slowdown in migration inflows. Utah’s population increased by 1.0 per cent, with growth largely attributable to natural change after net international migration, its largest contributor the previous year, declined.
The Northeast experienced the steepest slowdown in growth among the regions. After expanding by 0.8 per cent between 2023 and 2024, the region grew by just 0.2 per cent in the most recent period. Nationwide, all but five states recorded population growth. California, Hawaii, New Mexico, Vermont and West Virginia were the only states to see population declines between July 2024 and July 2025.
Thirty-three states and the District of Columbia recorded positive natural change between July 1, 2024, and June 30, 2025, meaning births outnumbered deaths. This marked a slight increase from the prior year and a significant rise from 2021, when only 24 states and the District of Columbia recorded positive natural change.
Like the nation as a whole, every state and the District of Columbia experienced lower net international migration during the period compared with the previous year, although all remained positive. Florida recorded the highest level of net international migration at 178,674, followed by Texas at 167,475, California at 109,278, and New York at 95,634.
Domestic migration patterns shifted as well. Thirty-one states recorded positive net domestic migration, up from 27 the previous year. Florida, long one of the top destinations for domestic movers, saw its net domestic migration fall sharply to 22,517 in 2025, down from 183,646 in 2023 and 310,892 in 2022. As a result, Florida ranked eighth nationally for net domestic migration in 2025. Neighbouring Alabama recorded a higher net domestic migration gain of 23,358 during the same period.
Separate estimates highlighted continued population decline in Puerto Rico. The island’s population fell by 17,686 to about 3.2 million between July 2024 and July 2025, a decline of 0.6 per cent. Puerto Rico has experienced a population decline in nearly every year since 2005. Census data show that the primary driver remains negative natural change, with deaths totalling 32,857 and births numbering 17,950 during the year. Net migration also turned negative at 2,779, reversing a positive net migration of 14,425 recorded the previous year.
The Census Bureau said the latest net international migration estimates reflect methodological improvements, including the incorporation of additional administrative data at subnational levels and adjustments to short-term projection methods. These changes are evident in national monthly population totals. Officials cautioned that comparisons should be made only within the same vintage of estimates, as each annual release revises the full time series back to the 2020 Census, superseding earlier vintages.
The Population Estimates Programme uses current data on births, deaths and migration to calculate population change since the most recent decennial census and produces annual estimates for the nation, the 50 states, the District of Columbia and Puerto Rico. In March, the Census Bureau is scheduled to release population totals and components of change for metropolitan and micropolitan statistical areas, counties and Puerto Rico municipios.
– global bihari bureau