January Trade Data Shows Strong Exports, Stronger Imports
Services Surplus Cushions Rising Merchandise Trade Gap
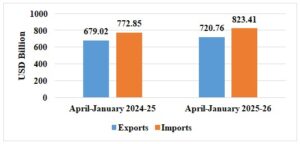
New Delhi: India’s external trade performance in the current financial year to date reflects a phase of steady expansion in exports alongside a faster rise in imports, resulting in a widening overall trade deficit even as services continue to generate a strong surplus. According to the latest official estimates, cumulative exports of merchandise and services during April–January 2025–26 reached US$ 720.76 billion, compared with US$ 679.02 billion in the corresponding period of the previous year, representing a growth of 6.15 per cent. Over the same period, total imports rose to US$ 823.41 billion from US$ 772.85 billion, an increase of 6.54 per cent. This divergence between export and import growth translated into an overall trade deficit of US$ 102.65 billion, wider than the US$ 93.83 billion recorded a year earlier, underscoring the pressure from higher import demand despite resilient export momentum. It is also noted that the data for parts of the previous year and the current year have been revised on a pro-rata basis using quarterly balance of payments figures, which is relevant for interpreting year-on-year comparisons.
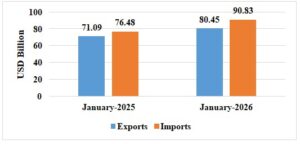
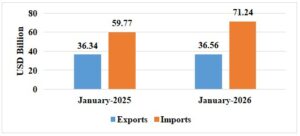
The monthly snapshot for January 2026 indicates a notable acceleration in trade activity. Total exports of goods and services were estimated at US$ 80.45 billion, registering a year-on-year growth of 13.17 per cent, while total imports climbed more sharply to US$ 90.83 billion, up 18.76 per cent from January 2025. This led to a trade deficit of US$ 10.38 billion for the month, nearly double the level recorded in the same month of the previous year. Merchandise exports in January 2026 stood at US$ 36.56 billion, marginally higher than US$ 36.34 billion in January 2025, whereas merchandise imports rose substantially to US$ 71.24 billion from US$ 59.77 billion, highlighting the role of import-intensive sectors and commodities in shaping the monthly imbalance.
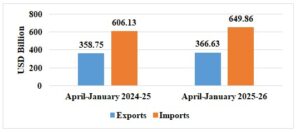
On a cumulative basis, merchandise exports during April–January 2025–26 reached US$ 366.63 billion compared with US$ 358.75 billion a year earlier, reflecting a growth of 2.20 per cent. Merchandise imports during the same period increased more rapidly to US$ 649.86 billion from US$ 606.13 billion, resulting in a merchandise trade deficit of US$ 283.23 billion, significantly higher than the US$ 247.38 billion recorded in April–January 2024–25. The expansion of the deficit points to strong domestic demand and elevated import requirements for energy, metals, machinery, and precious metals, even as export performance remained positive but comparatively subdued.
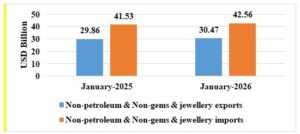
Non-petroleum exports offered a more encouraging picture over the longer period. Their cumulative value during April–January 2025–26 stood at US$ 320.94 billion, up from US$ 305.98 billion in the previous year, registering growth of 4.89 per cent. When petroleum, gems and jewellery are excluded together, exports during the same period rose to US$ 297.41 billion from US$ 281.59 billion, while corresponding imports increased to US$ 414.52 billion from US$ 381.21 billion. At the same time, the monthly data for January 2026 reveal a contrast within this trend, as non-petroleum exports showed a slight year-on-year decline even though cumulative non-petroleum exports for the financial year continued to expand. This divergence underlines short-term volatility in certain export segments against a broadly positive annual trajectory.
Sectoral trends in January 2026 indicate that growth in merchandise exports was driven primarily by engineering goods, petroleum products, meat, dairy and poultry products, marine products, and iron ore. Engineering goods exports rose by over 10 per cent year-on-year, petroleum product exports by more than 8 per cent, and iron ore exports by over 31 per cent, indicating a combination of industrial recovery and favourable global demand for select commodities. Agricultural and allied sectors also contributed positively, with strong growth in meat, dairy, poultry, marine products, coffee, and other cereals. At the same time, several traditional export segments recorded declines, notably gems and jewellery, rice, spices, and certain textile categories. Even in policy-priority sectors such as electronic goods and pharmaceuticals, growth was marginal in January, pointing to uneven momentum across the export basket despite the overall positive trend.
On the import side, January 2026 saw notable contractions in pulses, newsprint, chemical materials, iron and steel, coal and coke, project goods, and petroleum products, while sharp increases were observed in gold and silver imports, as well as in machinery, electronic goods, fertilisers, and non-ferrous metals. The surge in precious metal imports, particularly gold and silver, stood out as a major contributor to the overall import expansion and to the widening trade deficit for the month. This development offset the moderation seen in crude oil and coal imports and highlighted the sensitivity of the trade balance to movements in high-value discretionary and investment-related commodities.
Services trade continued to play a stabilising role in India’s external sector. Services exports in January 2026 were estimated at US$ 43.90 billion, up from US$ 34.75 billion in January 2025, while services imports rose to US$ 19.60 billion from US$ 16.71 billion. For the April–January period, services exports reached US$ 354.13 billion compared with US$ 320.28 billion a year earlier, and services imports stood at US$ 173.55 billion versus US$ 166.72 billion. This generated a services trade surplus of US$ 180.58 billion, higher than the US$ 153.56 billion recorded in the corresponding period of the previous year. The expansion of services exports by more than 10 per cent year-on-year underscores the sustained strength of sectors such as information technology, business services, and travel-related activities, and continues to touration but does not fully offset the merchandise trade deficit at the aggregate level. It is also noted that the services figures for January 2026 are provisional estimates, based on the most recent services data released by the Reserve Bank of India for December 2025.
Geographically, India’s export performance in January 2026 showed strong value growth to destinations such as the United Arab Emirates, China, Hong Kong, the Netherlands, and Italy. Over the cumulative April–January period, China, the United States, the United Arab Emirates, Spain, and Hong Kong emerged as the leading contributors to export growth. On the import side, the most significant increases in January 2026 were recorded from Switzerland, the United Arab Emirates, China, the United States, and the United Kingdom, while for the full April–January period, China, the United Arab Emirates, the United States, Hong Kong, and Singapore accounted for the largest increases in import value. These patterns reflect both diversification and concentration in India’s trade relationships, with Asia and key Western economies remaining central to overall trade flows.
Overall, the latest balance of trade update points to a dual narrative. On one hand, India’s export sector, particularly services and select manufacturing and agri-based segments, continues to demonstrate resilience and steady growth. On the other hand, the faster pace of import expansion, driven by precious metals, machinery, and industrial inputs, has led to a widening trade deficit in both monthly and cumulative terms. The sustained surplus in services trade has provided an important cushion against the merchandise deficit, but the data underline the importance of strengthening high-value exports and managing import dependence in critical sectors. The trajectory of the balance of trade in the remaining months of the financial year will depend on global demand conditions, commodity price trends, and the performance of India’s core export industries, as well as on the evolution of domestic consumption and investment-driven imports, within the context of provisional estimates and revised historical data used for comparison.
– global bihari bureau