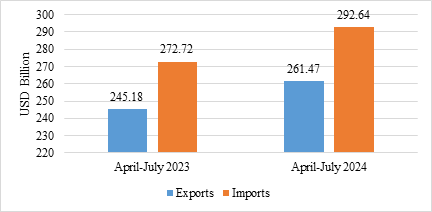
New Delhi: India’s total exports during April-July 2024 are estimated at $261.47 billion registering a positive growth of 6.65 per cent, data released today by the Ministry of Commerce & Industry revealed. Total imports during April-July 2024 are estimated at $292.64 billion registering a growth of 7.30 per cent.
India’s total exports (Merchandise and Services combined) for July 2024 are estimated at $62.42 Billion, registering a positive growth of 2.81 per cent vis-à-vis July 2023. Total imports (Merchandise and Services combined) for July 2024 are estimated at $72.03 Billion, registering a positive growth of 7.14 per cent vis-à-vis July 2023.
Merchandise exports during July 2024 were $33.98 billion compared to $34.49 billion in July 2023. Merchandise imports during July 2024 were $57.48 billion compared to $53.49 billion in July 2023.
Merchandise exports during April-July 2024 were $144.12 billion compared to $138.39 billion during April-July 2023. Merchandise imports during April-July 2024 were $229.70 billion compared to $213.53 billion during April-July 2023. Merchandise trade deficit during April-July 2024 was $85.58 billion compared to $75.15 billion during April-July 2023.
Non-petroleum and non-gems and jewellery exports in July 2024 were $26.92 billion compared to $25.47 billion in July 2023. Non-petroleum, non-gems and jewellery (gold, silver & precious metals) imports in July 2024 were $38.98 billion compared to $36.16 billion in July 2023.
Non-petroleum and non-gems and jewellery exports in April-July 2024 were $109.09 billion, compared to $102.81 billion in April-July 2023. Non-petroleum, non-gems and jewellery (gold, silver & precious metals) imports in April-July 2024 were $144.32 billion, compared to $138.25 billion in April-July 2023.
The estimated value of services exports for July 2024 was $28.43 billion compared to $26.22 billion in July 2023. The estimated value of services imports for July 2024 was $4.55 billion compared to $13.74 billion in July 2023.
The estimated value of service export during April-July 2024 is $117.35 billion as compared to $106.79 billion in April-July 2023. The estimated value of service imports during April-July 2024 is $62.95 billion compared to $59.19 billion in April-July 2023. The services trade surplus for April-July 2024 is $54.40 billion as compared to $47.60 billion in April-July 2023.
The top 5 export destinations, in terms of change in value, exhibiting positive growth in July 2024 vis a vis July 2023 were the Netherlands (29.18%), USA (3.15%), Tanzania (53.14%), Singapore (14.28%) and Mexico (25.91%).
The top 5 export destinations, in terms of change in value, exhibiting positive growth in April-July 2024 vis a vis April-July 2023 were the Netherlands (38.32%), USA (9.06%), United Arab Emirates (13.48%), Malaysia (51.86%) and Singapore (24.4%).
The top 5 import sources, in terms of change in value, exhibiting growth in July 2024 vis a vis July 2023 were United Arab Emirates (84.87%), China (13.05%), Russia (22.56%), Qatar (34.61%) and Indonesia (15.05%).
The top 5 import sources, in terms of change in value, exhibiting growth in April-July 2024 vis a vis April-July2023 were United Arab Emirates (47.07%), Russia (20.33%), China (9.66%), Iraq (19.4%) and Indonesia (17.19%).
– global bihari bureau


