Total Trade during June 2024
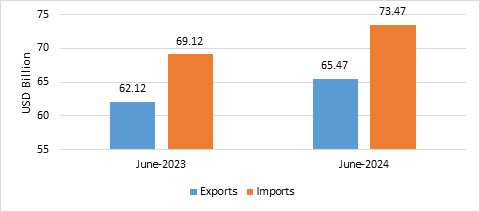
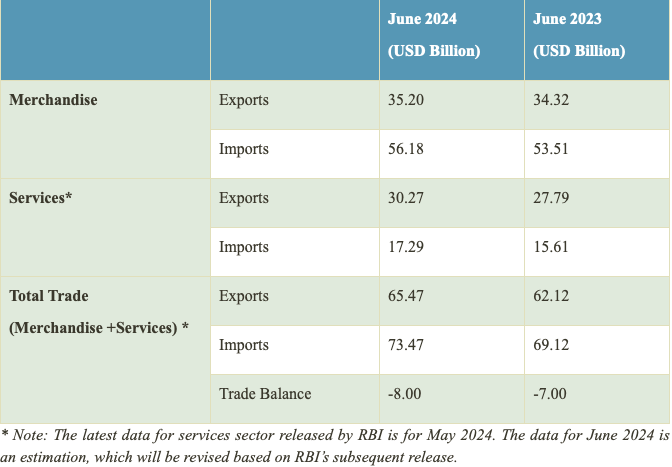
New Delhi: India’s total exports (Merchandise and Services combined) for June 2024 are estimated at $65.47 Billion, registering a positive growth of 5.40 per cent vis-à-vis June 2023.
Total imports (Merchandise and Services combined) for June 2024 are estimated at $73.47 Billion, registering a positive growth of 6.29 per cent vis-à-vis June 2023, the latest data released today by the Ministry of Commerce & Industry revealed.
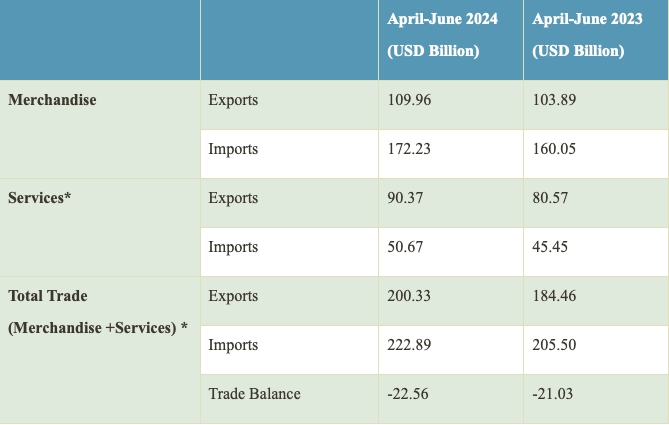
Moreover, India’s total exports during April-June 2024 are estimated at $200.33 Billion registering a positive growth of 8.60 per cent. Total imports during April-June 2024 are estimated at $222.89 Billion registering a growth of 8.47 per cent.
The merchandise exports during June 2024 were $35.20 Billion as compared to $34.32 Billion in June 2023. Merchandise imports during June 2024 were $56.18 Billion as compared to $53.51 Billion in June 2023. Merchandise exports during April-June 2024 were $109.96 Billion as compared to $103.89 Billion during April-June 2023. Merchandise imports during April-June 2024 were $172.23 Billion compared to $160.05 Billion during April-June 2023. Merchandise trade deficit during April-June 2024 was $62.26 Billion compared to $56.16 Billion during April-June 2023.
The major drivers of merchandise export growth in June 2024 included Engineering Goods, Electronic Goods, Drugs & Pharmaceuticals, Coffee and Organic & Inorganic Chemicals. Engineering Goods exports increased by 10.27% from $8.52 Billion in June 2023 to $9.39 Billion in June 2024. Electronic goods exports increased by 16.91% from $2.42 Billion in June 2023 to $2.82 Billion in June 2024. Drugs and pharmaceutical exports increased by 9.93% from $2.25 Billion in June 2023 to $2.47 Billion in June 2024. Coffee exports increased by 70.02% from $0.12 Billion in June 2023 to $0.20 Billion in June 2024. Organic & Inorganic Chemicals exports increased by 3.32% from USD 2.22 Billion in June 2023 to USD 2.29 Billion in June 2024.
Non-petroleum and non-gems & jewellery exports in June 2024 were $27.43 Billion compared to $25.29 Billion in June 2023. Non-petroleum, non-gems & jewellery (gold, silver & precious metals) imports in June 2024 were $36.04 Billion compared to $33.66 Billion in June 2023. Non-petroleum and non-gems & jewellery exports in April-June 2024 were $81.90 Billion, compared to $77.33 Billion in April-June 2023. Non-petroleum, non-gems & jewellery (gold, silver & precious metals) imports in April-June 2024 were $105.35 Billion, compared to $102.10 Billion in April-June 2023.
The estimated value of services exports for June 2024 is $30.27 Billion as compared to $27.79 Billion in June 2023. The estimated value of services imports for June 2024 is $17.29 Billion as compared to $15.61 Billion in June 2023. The estimated value of service exports during April-June 2024 is $90.37 Billion as compared to $80.57 Billion in April-June 2023.
The estimated value of service imports during April-June 2024 is $50.67 Billion as compared to $45.45 Billion in April-June 2023. The services trade surplus for April-June 2024 is $39.70 Billion as compared to $35.12 Billion in April-June 2023.
– global bihari bureau


