The trade deficit in December 2021 was USD 21.99 billion
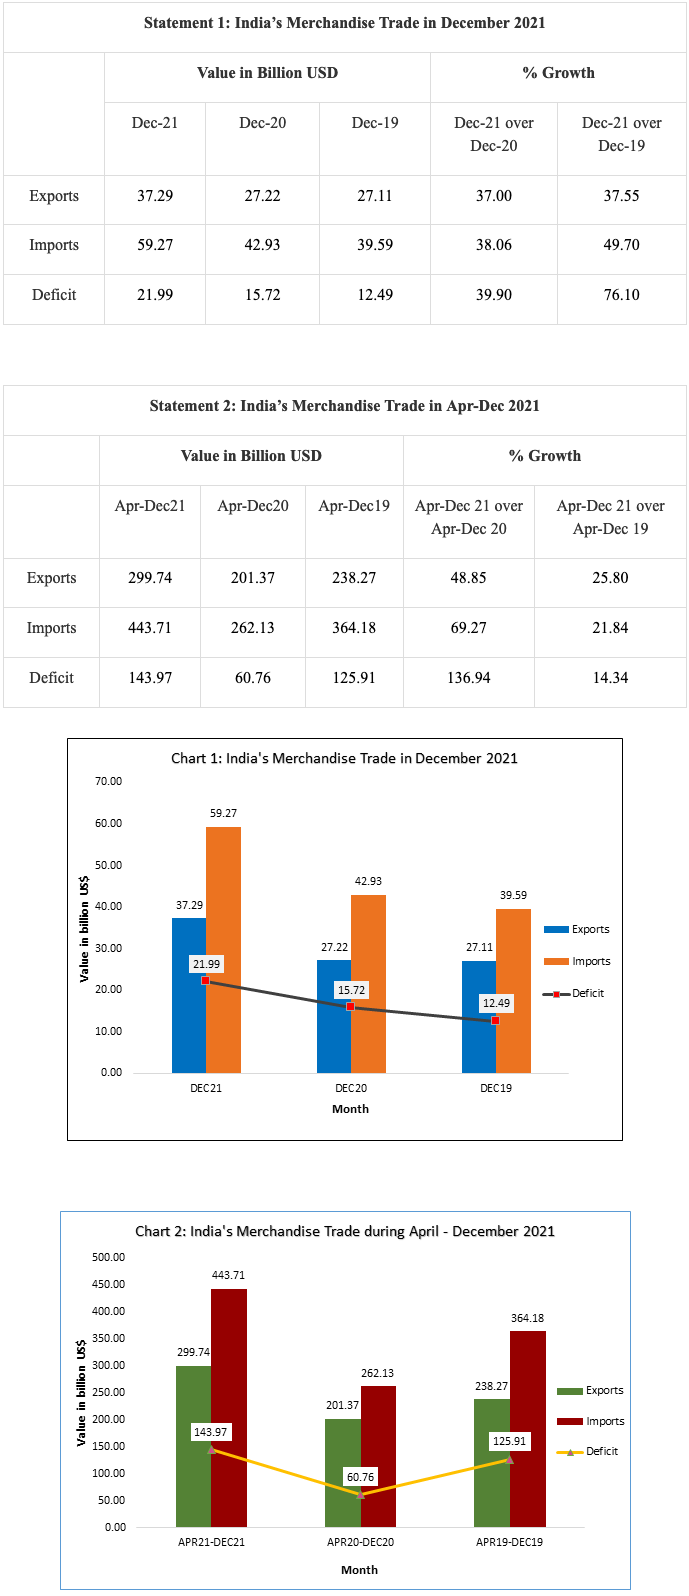
New Delhi: Preliminary data showed that India’s merchandise export in December 2021 was USD 37.29 billion, the highest ever monthly achievement, which shows an increase of 37.0% over USD 27.22 billion in December 2020 and an increase of 37.55% over USD 27.11 billion in December 2019, the Ministry of Commerce & Industry, stated here today.
India’s merchandise export in April-December 2021 was USD 299.74 billion, an increase of 48.85% over USD 201.37 billion in April-December 2020 and an increase of 25.80% over USD 238.27 billion in April-December 2019.
India’s merchandise import in December 2021 was USD 59.27 billion, an increase of 38.06% over USD 42.93 billion in December 2020 and an increase of 49.7% over USD 39.59 billion in December 2019.
India’s merchandise import in April-December 2021 was USD 443.71 billion, an increase of 69.27% over USD 262.13 billion in April-December 2020 and an increase of 21.84% over USD 364.18 billion in April-December 2019.
The trade deficit in December 2021 was USD 21.99 billion, while it was 143.97 billion USD during April-December 2021.
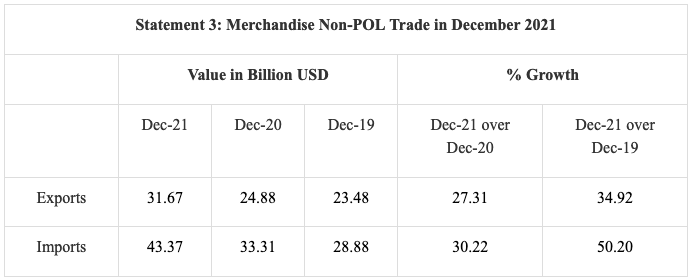
Value of non-petroleum exports in December 2021 was 31.67 USD billion, registering a positive growth of 27.31% over non-petroleum exports of USD 24.88 billion in December 2020 and a positive growth of 34.92% over non-petroleum exports of USD 23.48 billion in December 2019.
Value of non-petroleum imports was USD 43.37 billion in December 2021 with a positive growth of 30.22% over non-petroleum imports of USD 33.31 billion in December 2020 and a positive growth of 50.20% over non-petroleum imports of USD 28.88 billion in December 2019.
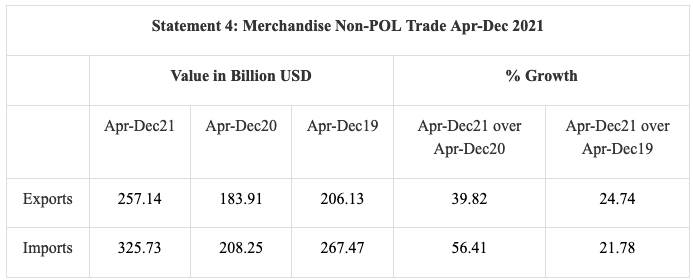
The cumulative value of non-petroleum exports in April-December 2021 was USD 257.14 billion, an increase of 39.82% over USD 183.91 billion in April-December 2020 and an increase of 24.74% over USD 206.13 billion in April-December 2019.
The cumulative value of non-petroleum imports in April-December 2021 was USD 325.73 billion, showing an increase of 56.41% compared to non-oil imports of USD 208.25 billion in April-December 2020 and an increase of 21.78% compared to non-oil imports of USD 267.47 billion in April-December 2019.
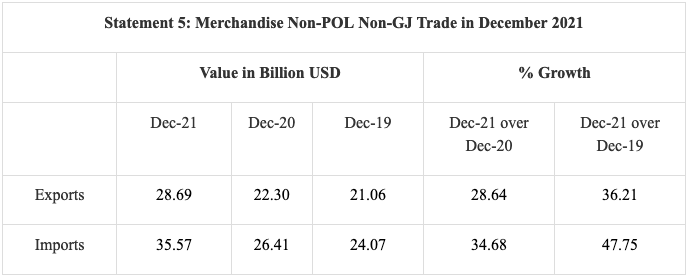
Value of non-petroleum and non-gems and jewellery exports in December 2021 was USD 28.69 billion, registering a positive growth of 28.64% over non-petroleum and non-gems and jewellery exports of USD 22.30 billion in December 2020 and a positive growth of 36.21% over non-petroleum and non-gems and jewellery exports of USD 21.06 billion in December 2019.
Value of non-oil, non-GJ (gold, silver & Precious metals) imports was USD 35.57 billion in December 2021 with a positive growth of 34.68% over non-oil and non-GJ imports of USD 26.41 billion in December 2020 and a positive growth of 47.75% over non-oil and non-GJ imports of USD 24.07 billion in December 2019.
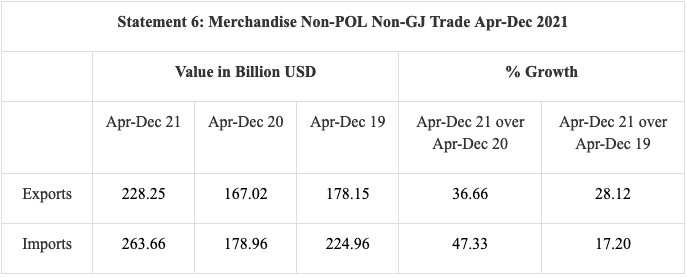
The cumulative value of non-petroleum and non-gems and jewellery exports in April-December 2021 was USD 228.25 billion, an increase of 36.66% over cumulative value of non-petroleum and non-gems and jewellery exports of USD 167.02 billion in April-December 2020 and an increase of 28.12% over cumulative value of non-petroleum and non-gems and jewellery exports of USD 178.15 billion in April-December 2019.
Non-oil, non-GJ (Gold, Silver & Precious Metals) imports was USD 263.66 billion in April-December 2021, recording a positive growth of 47.33%, as compared to non-oil and non-GJ imports of USD 178.96 billion in April-December 2020 and a positive growth of 17.20% over USD 224.96 billion in April-December 2019.
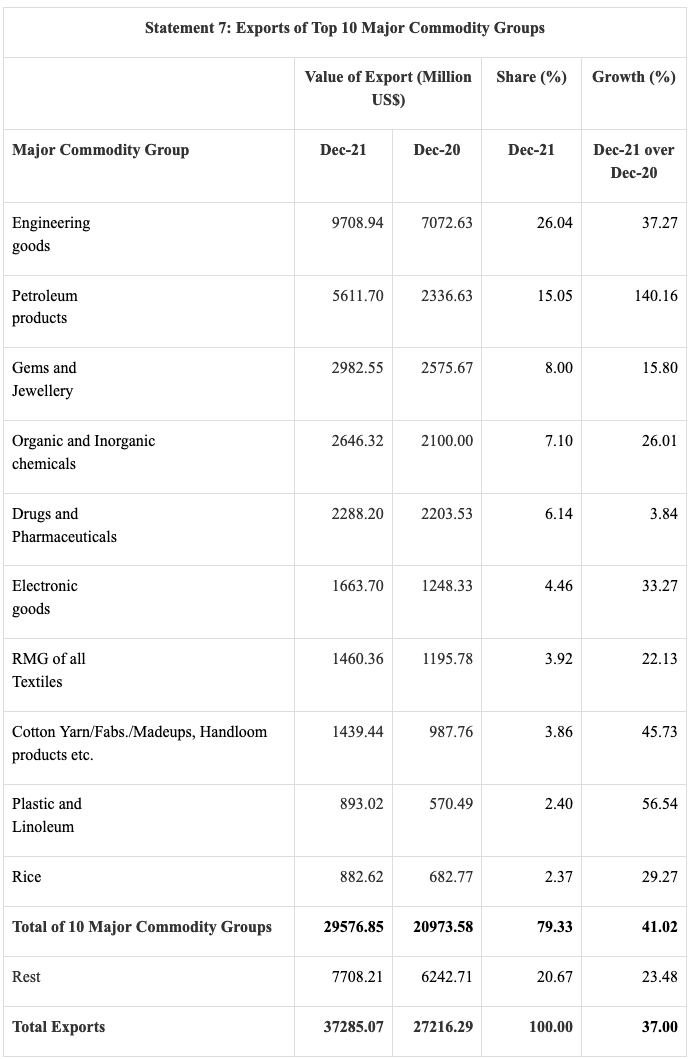
Top 10 major commodity groups covering 79% of total exports and showing positive growths in December 2021 over corresponding month of previous year, are –
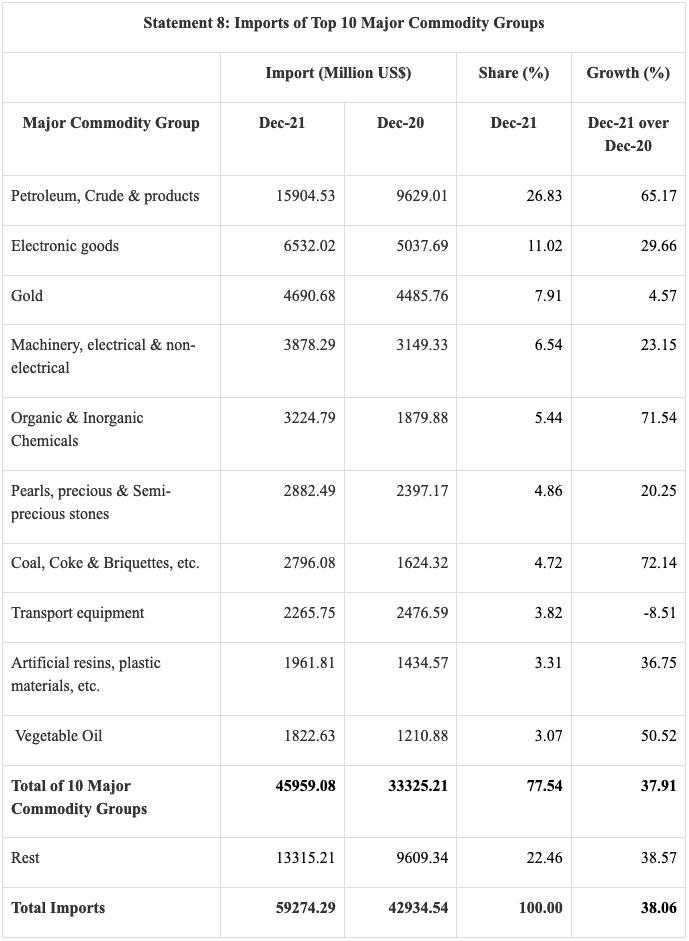
Top 10 major commodity groups covering 78% of total imports, are –
– global bihari bureau


